Understand hard drive S.M.A.R.T. early warning signals and stay away from worries about data loss
Original link: https://www.itylq.com/understanding-smart-attributes-for-harddrives.html
Release date: 2025-03-27 Migration time: 2026-03-21
I've been having a big headache lately. A mechanical hard drive that stored important data crashed, and I haven't backed up the data yet. I really regret it. In fact, most things happen with signs. As long as you take a quick glance at the S.M.A.R.T. health information on your hard drive, you can completely avoid the tragedy. Before the avalanche, I never realized that the humble S.M.A.R.T. message could be so important...
S.M.A.R.T. is the abbreviation of Self-Monitoring, Analysis, and Report Technology. It is an important function of the hard disk and is used to monitor the health status of the device and predict potential failures.
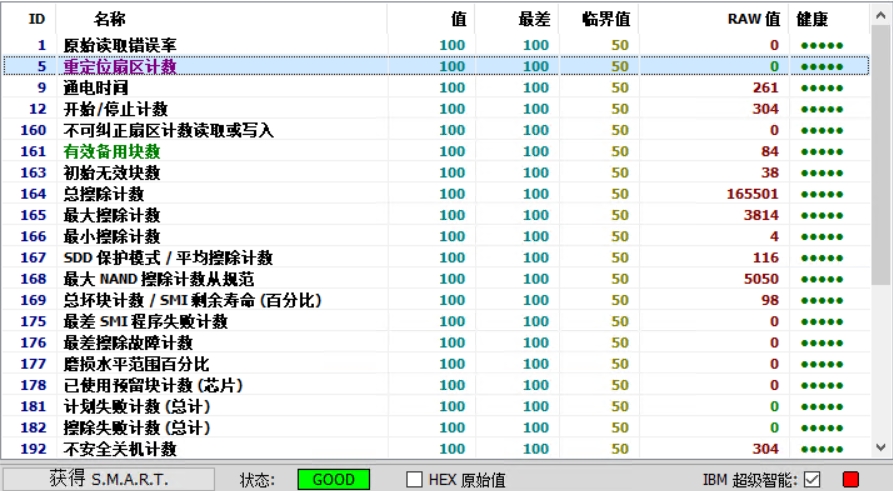
Through third-party tools, you can quickly view various S.M.A.R.T information of the hard disk, but how to understand the "value", "worst", "critical value" and "RAW value" in each monitoring item? As shown in Figure 1 below.
1 Design of S.M.A.R.T attribute values
SMART status contains two types of values, normalized values and RAW values.
The normalized value is a standardized value, ranging from 0 to 253. The products produced by different manufacturers are different. A higher value means a better health status. The "value", "worst" and "critical value" in the above figure are normalized values.
The RAW value is the raw data read from the hard disk firmware. It records the actual number of events that occurred, such as the number of redirected sectors, the number of bad sectors, etc., similar to a counter. The larger the RAW value is, the more times it occurs and the higher the frequency of hard drive abnormalities.
2 The meaning of each attribute value
- "Value" represents the current SMART attribute value. Higher numbers indicate better health.
- "Worst" indicates the lowest value recorded since the hard drive started to be used, reflecting the historical trend of the hard drive's health status. A higher value indicates that the hard drive has maintained a better state throughout the entire use cycle;
- The "critical value" is the threshold set by the manufacturer. When the "value" is lower than the threshold, SMART considers that there is a potential problem with the hard disk;
- The "ROW value" is the actual data (sum) recorded by the hard disk firmware. If the ROW value exceeds the "critical value", it does not mean that there is a problem with the hard disk at that moment. It only means that the hard disk has had a larger number of events in its history.
Example: Take the "C5 relocation sector count" in the above figure as an example
- value=100
- Worst=100
- critical value=50
- RAW value=0
"Value=100" means that the current hard disk's relocation sector count is in a completely healthy initial state; "Worst=100" means that the hard disk has never experienced any situation that may cause the relocation sector count to increase; "Critical value=50" means that when the "value" drops to 50 or lower, SMART will issue a warning message and considers that the hard disk has potential problems to be dealt with; "RAW value=0" means that no sectors have been remapped and no bad sectors have been detected on the hard disk.
3 Additional Note: How to understand "value" and "RAW value"
"Value" is a relative quantity used to measure the current status of the hard disk, and its most important reference object is the "critical value". "Value" is like temperature. We can express it in Fahrenheit or Celsius. It is meaningless to just talk about the numerical value. Only by anchoring a baseline can we tell whether the current weather is cold or hot.
The "RAW value" is similar to a cumulative counter. It faithfully records the total number of abnormal events that occurred in the history of the hard disk. Its value may be 0 or very large, but it cannot indicate whether the current hard disk status is good or bad. It can only reflect the frequency of the abnormal event in the history of the hard disk and the predicted probability of its occurrence in the future.
This article was moved from WordPress to MkDocs