A Comprehensive Guide to Hard Drive Performance Metrics: Read/Write Speed, Throughput, Bandwidth, IOPS, and Latency
Original Link: https://www.itylq.com/knowledge-of-harddisk-metrics.html
Publication Date: 2024-11-21 Migration Date: 2026-03-21
In the era of portable hard drives, the quality of a drive was generally measured by its large-file transfer speed. However, in today’s “everything-can-be-moved-to-the-cloud” era, we are increasingly concerned with the IOPS of cloud storage. While higher transfer speeds and IOPS are naturally better, blindly chasing these numbers can easily lead you into the traps of internet marketing. This article aims to clarify the key performance metrics of hard drives and cloud storage, helping you make better and more informed purchasing decisions.
1 Explanation of Technical Terms
- Transfer Speed: Also known as read/write speed, this term was common in the era of portable hard drives. It refers to the “average transfer speed of large files.” If tested with small, random files, the measured values will drop sharply. Manufacturers typically highlight the highest values of their products to grab attention, making it difficult for ordinary consumers to discern the nuances.
- Throughput: This refers to the actual amount of data read or written by a cloud drive or storage system per unit of time (typically seconds, s), with the default unit being Mbps. It is a measured value that varies over time. Conceptually, throughput is somewhat similar to “transfer speed,” but in network environments—particularly in cloud disk/storage buckets/storage systems built with multiple physical disks, such as disk arrays—throughput is generally used to reflect the read/write performance of storage devices, while “transfer speed” is rarely used. The specific reasons for this will be discussed later in this article under “The Relationship Between IOPS, Transfer Speed, and Throughput.”
- Bandwidth: The maximum amount of data that a cloud disk/storage system can read or write per unit of time (seconds, s), measured in Mbps. It is a constant scalar value. To put it simply, bandwidth represents the transmission channel or pipeline provided by the cloud disk/storage system, while throughput represents the actual data flowing through that pipeline.
- IOPS: Input/Output Operations Per Second. This refers to the number of read and write operations performed by a cloud disk or storage system per unit of time (seconds, s), and is also a measured value.
- Latency: The time interval from sending an I/O request to receiving a response, i.e., the speed at which a single I/O request is processed. Generally, minimum, maximum, and average latency are used to evaluate overall latency performance.
Note: While actual measured values are not meaningful for assessing the performance of a cloud disk or storage system, their upper and lower limits certainly are. In everyday discussions, we often say that a certain cloud disk or storage system has a throughput of XX Mbps or an IOPS of 100,000+, etc., referring to its maximum value.
2 Common Factors Affecting IOPS
IOPS is influenced by various factors, including the read-write ratio, read-write methods (sequential and random), number of threads, queue depth, data record size, system configuration, operating system, disk drives, and more.
Among these, the number of threads, read-write methods, and data record size (data blocks) can significantly impact the final IOPS count. There is little value in directly comparing IOPS figures across different testing platforms or cloud service providers. Be cautious of claims of 100,000+ or 1 million+ IOPS—check if there are any qualifying conditions hidden behind these numbers. As we all know, with enough qualifying conditions, nothing is impossible...
3 The Relationship Between IOPS, Transfer Speed, and Throughput
Transfer speed, throughput, and IOPS can be viewed as a progressive and complementary relationship.
Transfer speed reflects only the physical characteristics of storage devices, such as interface specifications and transmission media, and cannot measure the impact of factors like network congestion on data read/write operations;
Throughput, however, effectively compensates for the limitations of transfer speed. It reflects the actual read/write performance of the entire storage system under real-world conditions, taking into account various factors such as hardware, software, protocol stacks, network conditions, and temperature;
While transfer speed and throughput effectively measure the sequential read/write capabilities of hard drives and storage systems, they are less intuitive when it comes to random read/write operations. This is why IOPS was introduced.
When reviewing IOPS metrics provided by major storage vendors or cloud service providers, it is essential to examine the benchmarking methods they employ. Different testing methods yield vastly different results. Common IOPS testing methods include: 4KB random read/write, 4KB 64-thread random read/write, 64KB random read/write, 16MB random read/write, and so on.
For example, industry-leading hard drive manufacturers such as Western Digital and Seagate commonly use the 4KB random read/write method. By default, when people refer to the IOPS of a specific hard drive model, they are typically referring to its 4KB random read/write performance.
Under specific conditions, IOPS and throughput can be converted into one another:
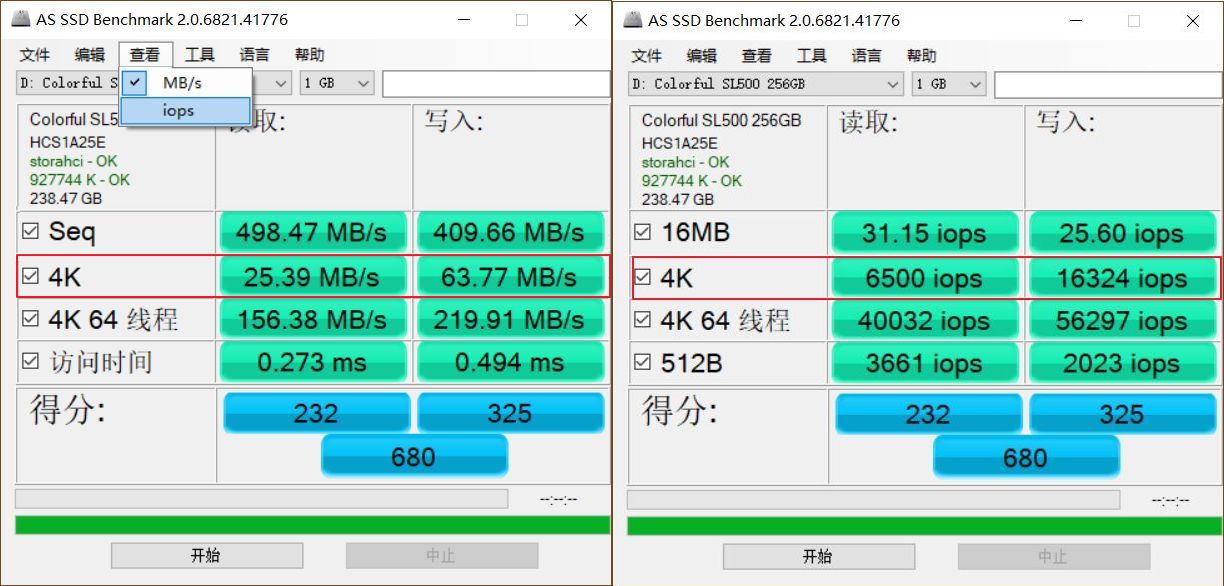
Example: When conducting a 4KB random read/write test on an SSD, the results show IOPS (4K read) = 6500 and IOPS (4K write) = 16324, as shown in Figure 1.
We can calculate its throughput: #Throughput is generally denoted as TP
TP (4K read) = 6500 * 4 / 1024 = 25.390625 MB/s = 203.125 Mbps
TP (4K write) = 16324 * 4 / 1024 = 63.765625 MB/s = 510.125 Mbps
As shown on the left side of the AS SSD Benchmark screenshot, the conversion relationship between these values is entirely accurate.
4. The Relationship Between IOPS, Bandwidth, and Latency
Latency generally consists of two parts: system latency + (queue) wait latency. System latency is difficult to change, but IOPS and bandwidth directly affect wait latency.
Take a supermarket checkout as an example. Suppose there are currently 10 customers waiting to check out (IOPS), 5 checkout lanes (bandwidth), each lane staffed by one cashier, and each cashier takes a constant 10 seconds to process each transaction (system latency). In this case, the average latency is:

Suppose we double the bandwidth—that is, increase the number of checkout lanes to 10—while keeping all other conditions constant. The average latency would then be:
Average latency = System latency = 10s
Many storage vendors and cloud service providers often boast about how high the IOPS of their storage systems are and how fast their performance is during marketing campaigns, but using IOPS alone to measure the quality of a storage system’s performance is deceptive**.
As the old saying goes, “Practice is the sole criterion for testing truth.” When it comes to cloud disks and storage systems, what users directly perceive is response latency; the level of latency is the sole criterion for evaluating storage system performance.
5 How to Balance Performance Metrics Like IOPS, Throughput, and Bandwidth During Actual Procurement
Base your decisions on actual needs while balancing cost-effectiveness. The following guidelines may serve as a reference:
- For use cases involving frequent random read/write operations—such as databases, email, and source code management—focus on random read/write performance; IOPS is the key metric.
- For use cases involving frequent sequential read/write operations—such as live streaming, video conferencing, and other audio/video streams, as well as large file sharing—focus on sequential read/write performance; data throughput is the key metric.
- You can adjust bandwidth by configuring RAID or adding hard drives, but latency issues are difficult to resolve. When deploying applications, thoroughly test and evaluate whether the current latency is acceptable;
- Store hot data on high-IOPS SSDs and cold data on high-capacity, cost-effective HDDs.
This article was migrated from WordPress to MkDocs